RunningVersion 1.2.0 is out

Your clusters,
at a glance.

Lumovi is a fast Kubernetes dashboard. It shows what’s healthy, what’s struggling and where your capacity goes: on your desktop for every cluster in your kubeconfig, or in a browser for the whole team, from one cluster to a fleet.

  • Free and open source
  • macOS, Windows and Linux
  • Helm chart for any cluster
  • No telemetry

Pod health

  • Running 28
  • Warning 3
  • Failing 5
  • Starting 0
  • Completed 2

Hover a pod. Click a failing one to restart it.Tap a pod. Tap a failing one again to restart it.Everything’s running. Nice work.

Every cluster

All your clusters, checked before you open one.

Lumovi reads your kubeconfig and asks every cluster’s API server for its version, so you see which ones answer, how fast, and which don’t. Open one, and switch with ⌘K from anywhere.

Clusters

Connect your clusters
The app

One calm window for every cluster in your kubeconfig.

Pick a cluster and Lumovi shows you how it’s doing. Problems sort to the top, usage sits next to capacity, and the details are one click away. It follows your system’s light or dark, and every status has an icon and a label, never color alone.

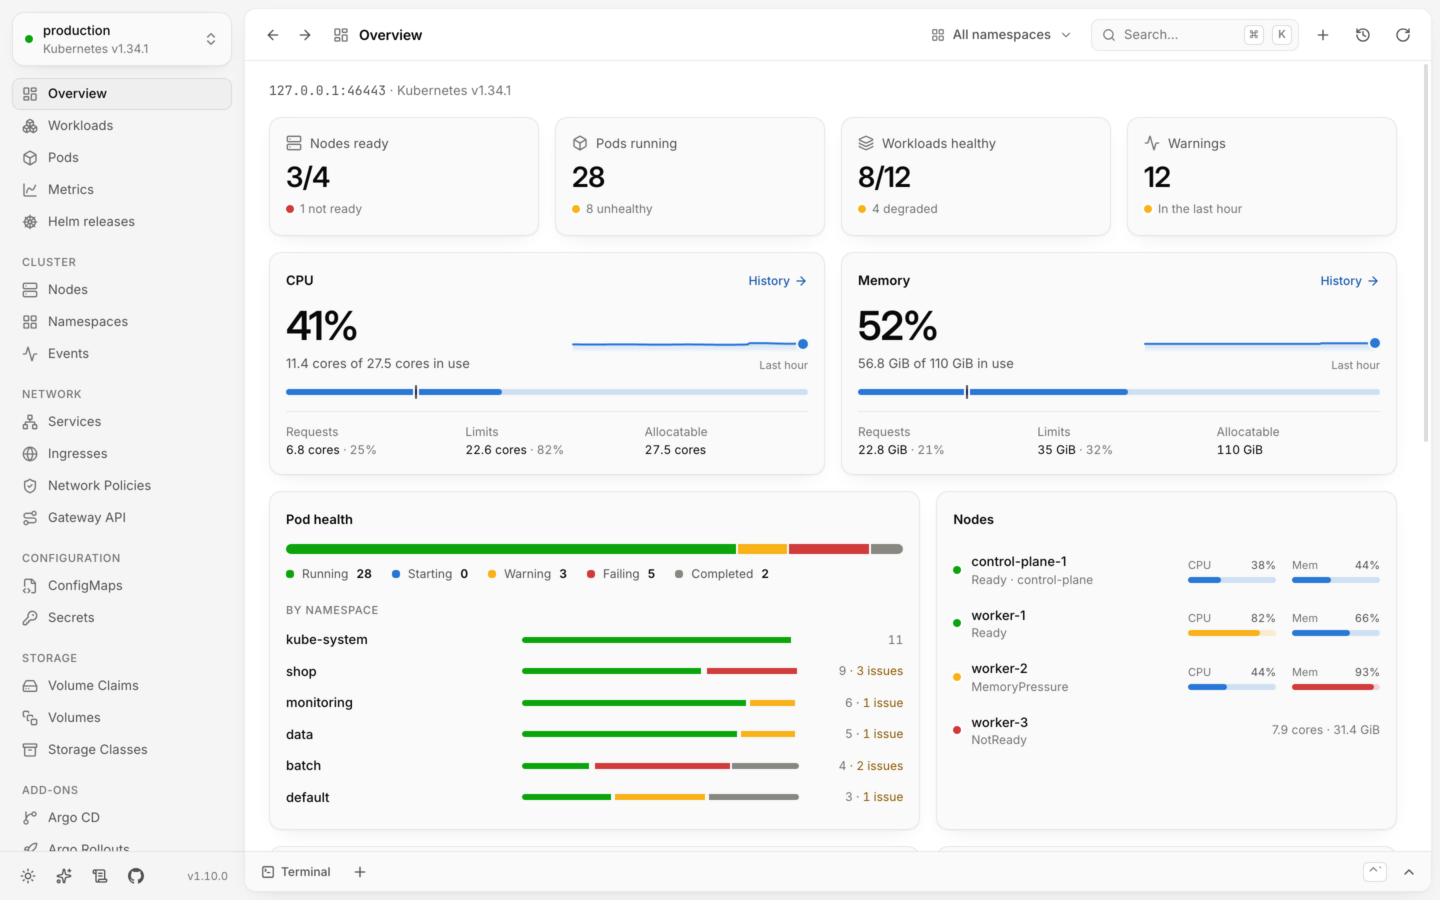
The overview: nodes ready, pods running, CPU and memory against capacity, pod health by namespace, and each node’s usage.The overview: nodes ready, pods running, CPU and memory against capacity, pod health by namespace, and each node’s usage.
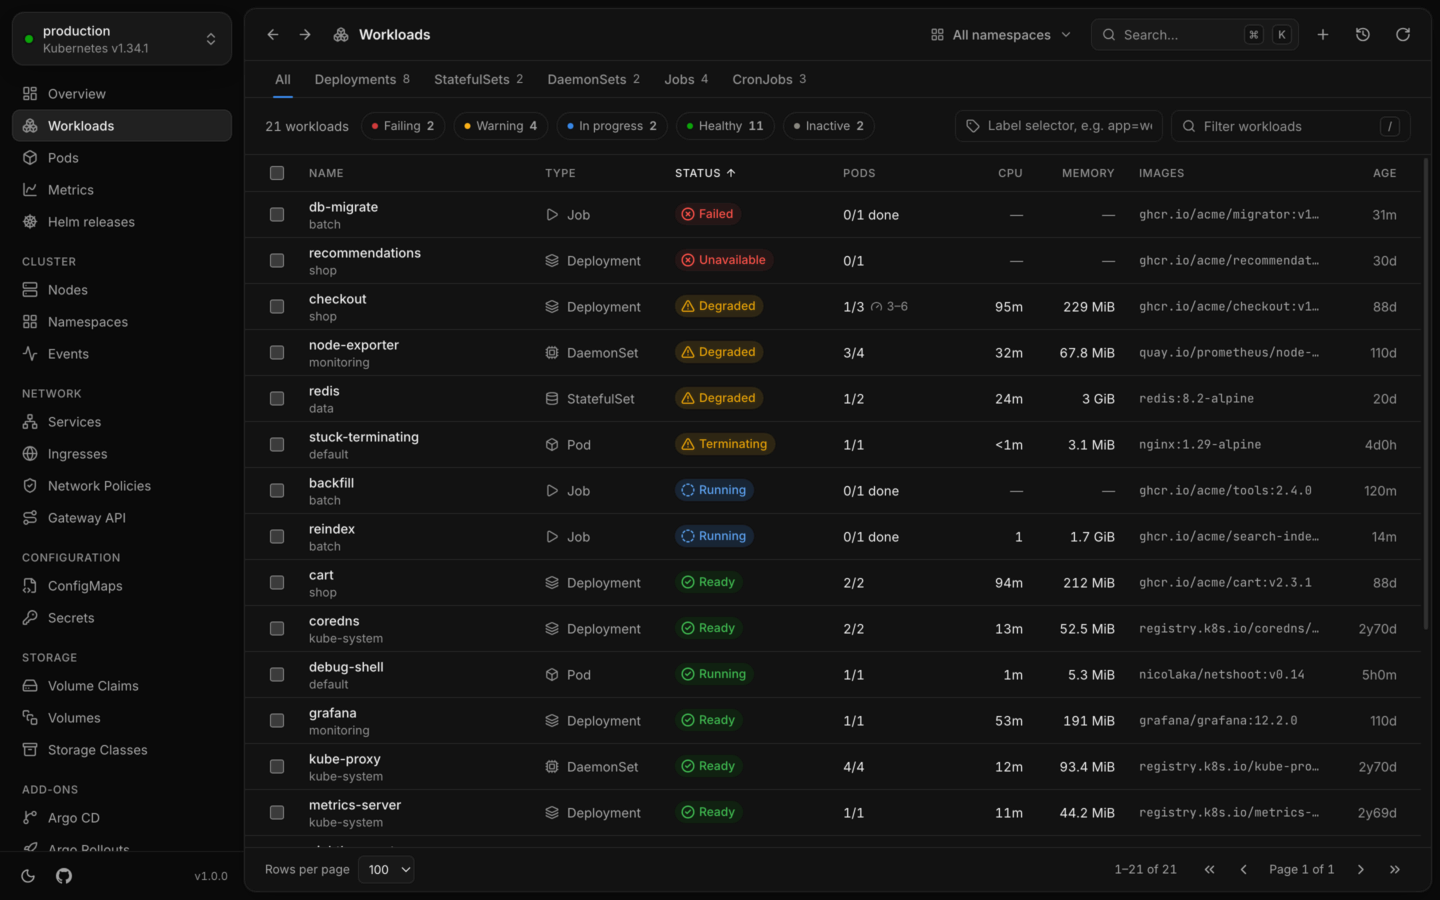
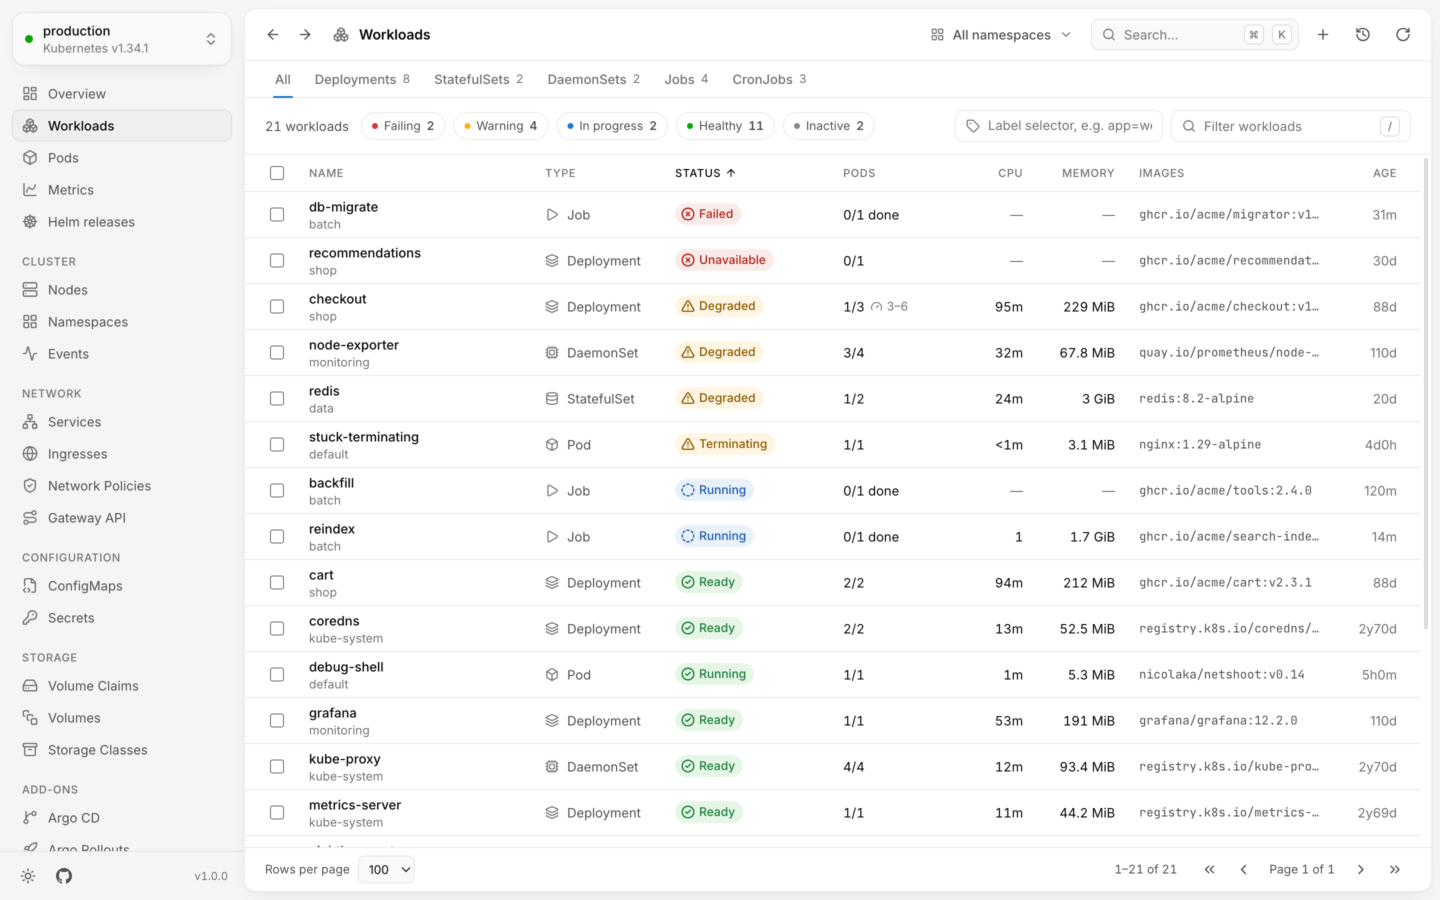
Every workload in one list, sorted with failing and degraded ones first.Every workload in one list, sorted with failing and degraded ones first.
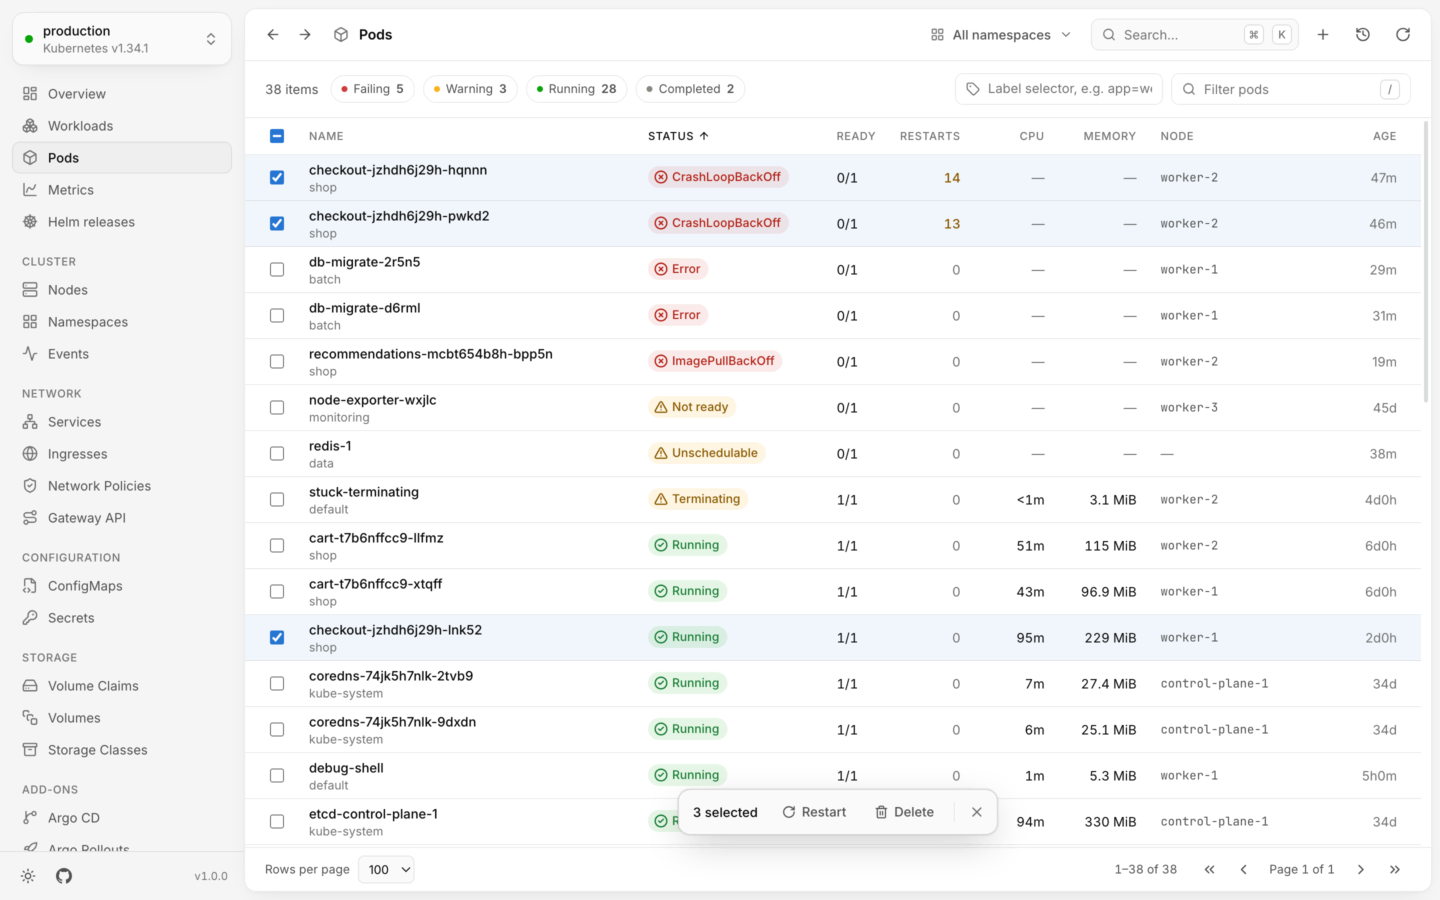
The pods list with three pods selected and a bar to restart or delete them together.The pods list with three pods selected and a bar to restart or delete them together.
CPU by namespace over six hours, with a distribution and a ranked table.CPU by namespace over six hours, with a distribution and a ranked table.
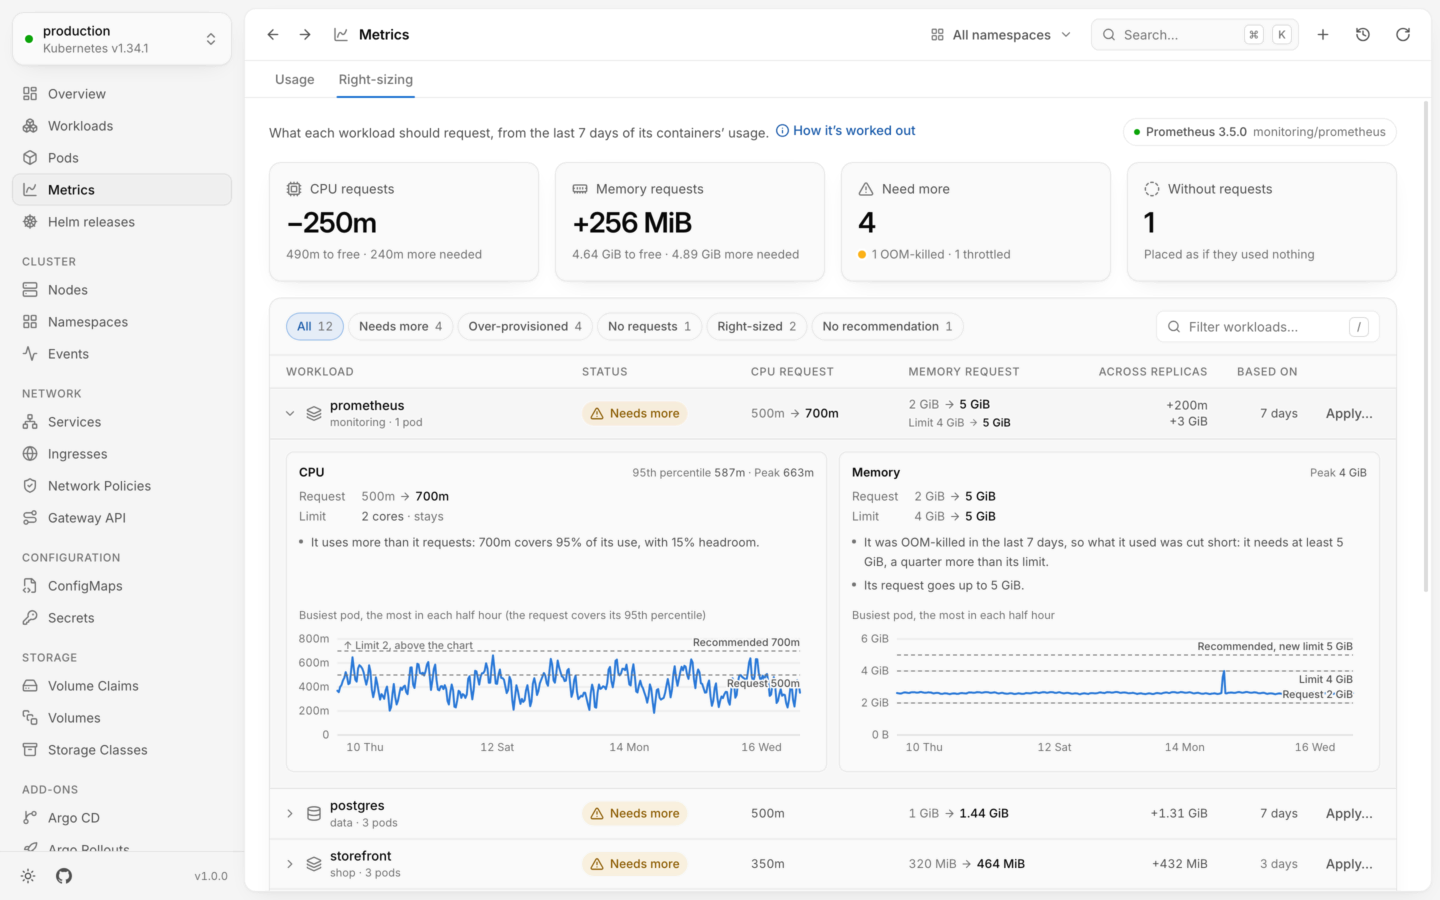
Right-sizing, in Metrics: what each workload should request from a week of its usage. Prometheus needs more memory after it was OOM-killed, with its week charted against its request and limit.Right-sizing, in Metrics: what each workload should request from a week of its usage. Prometheus needs more memory after it was OOM-killed, with its week charted against its request and limit.
Logs from all three pods of the checkout deployment, merged in order with each line marked by its pod.Logs from all three pods of the checkout deployment, merged in order with each line marked by its pod.
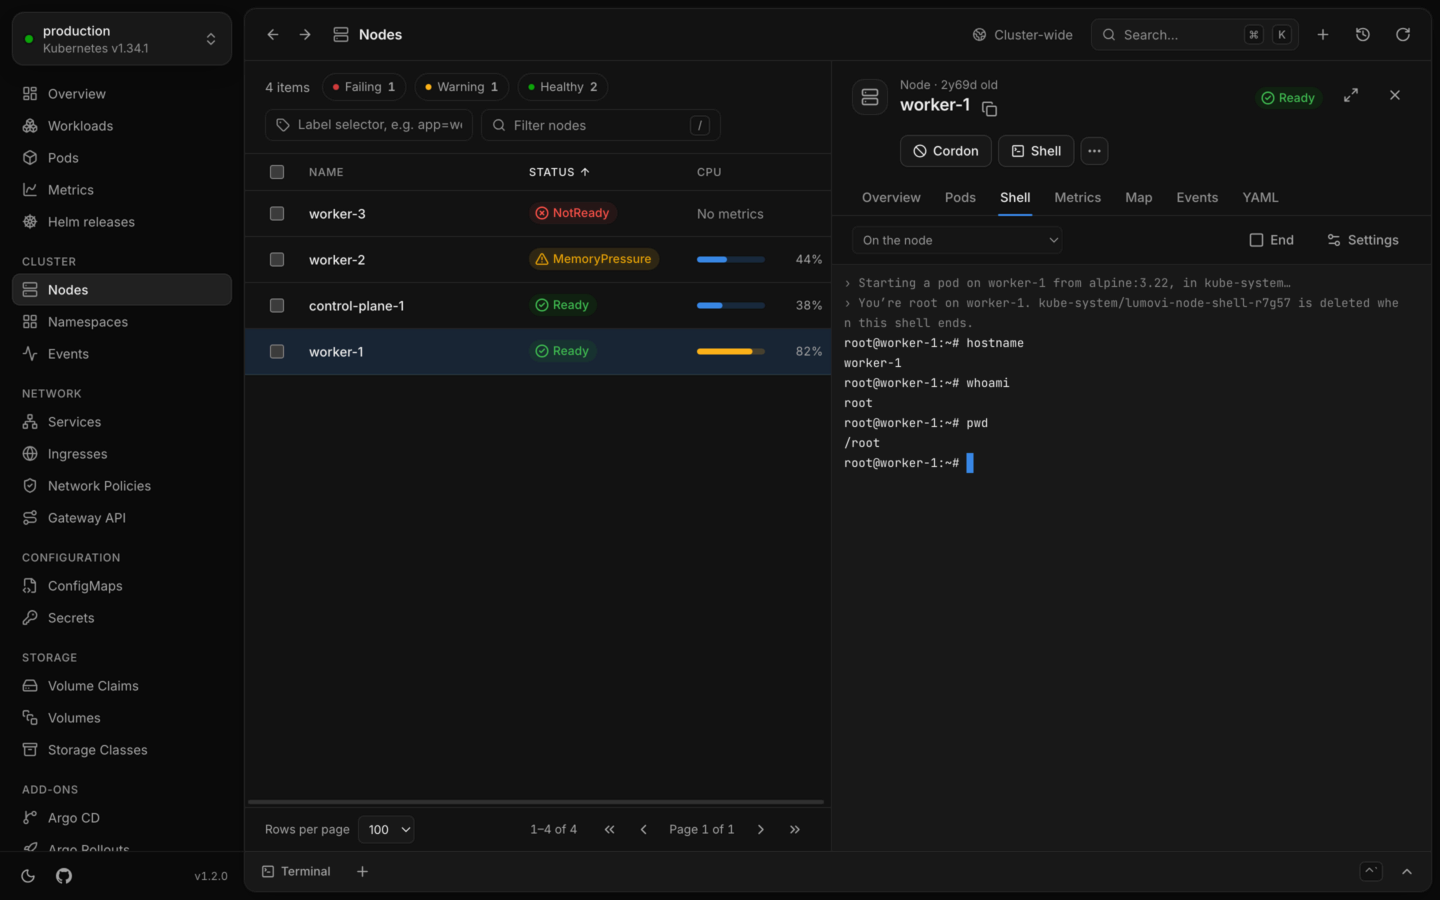
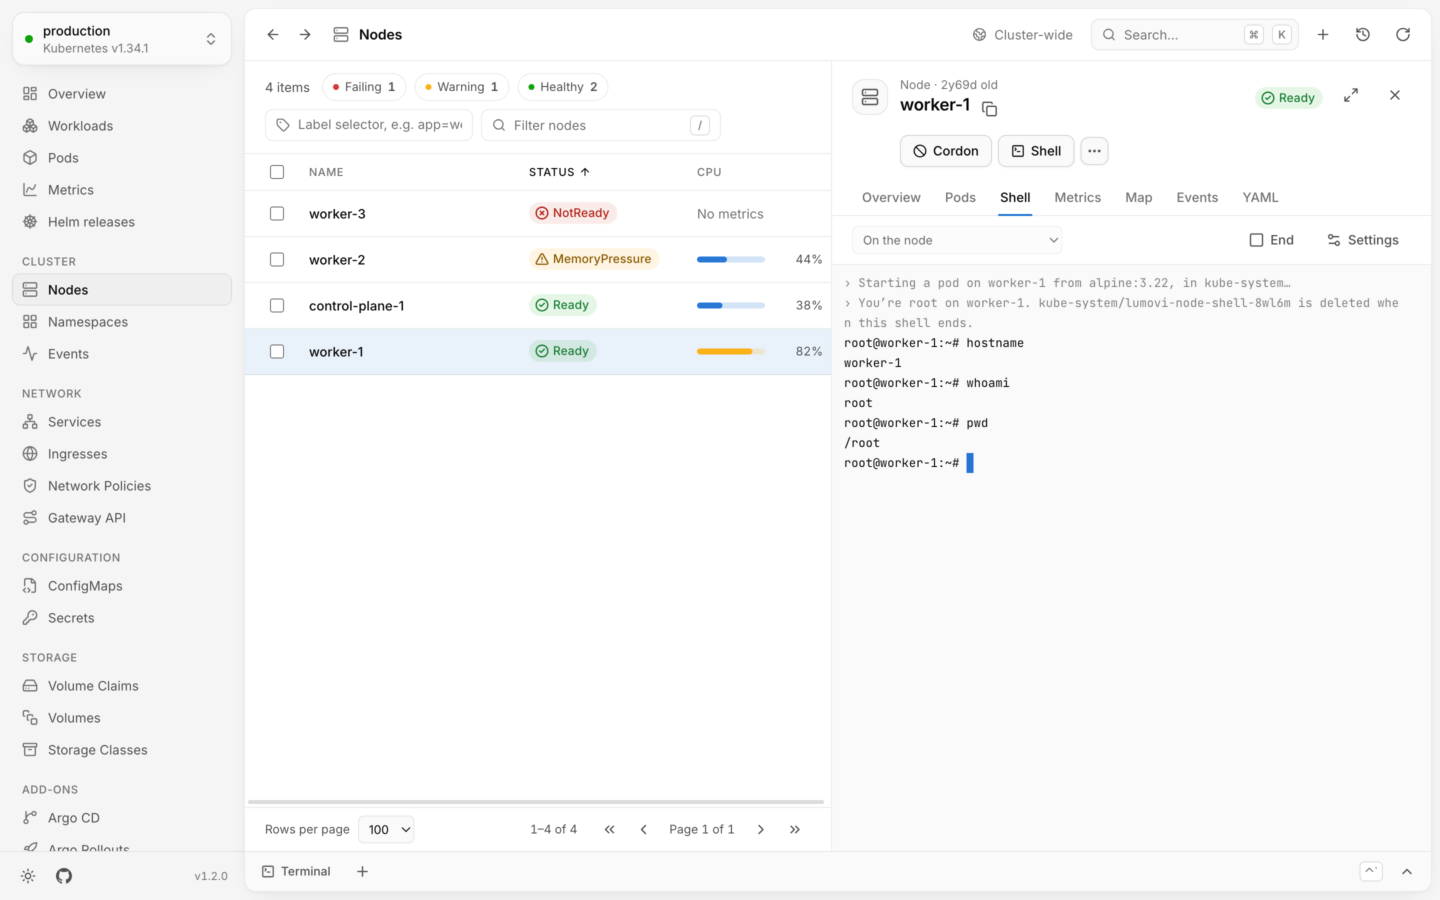
The Nodes page with worker-1’s Shell tab open: root on the node, after Lumovi says which pod it started there and that the pod goes when the shell ends.The Nodes page with worker-1’s Shell tab open: root on the node, after Lumovi says which pod it started there and that the pod goes when the shell ends.
The deployments page with a terminal open along the bottom, running kubectl get deployments in the shop namespace, under Lumovi’s line saying kubectl points at production in this terminal.The deployments page with a terminal open along the bottom, running kubectl get deployments in the shop namespace, under Lumovi’s line saying kubectl points at production in this terminal.
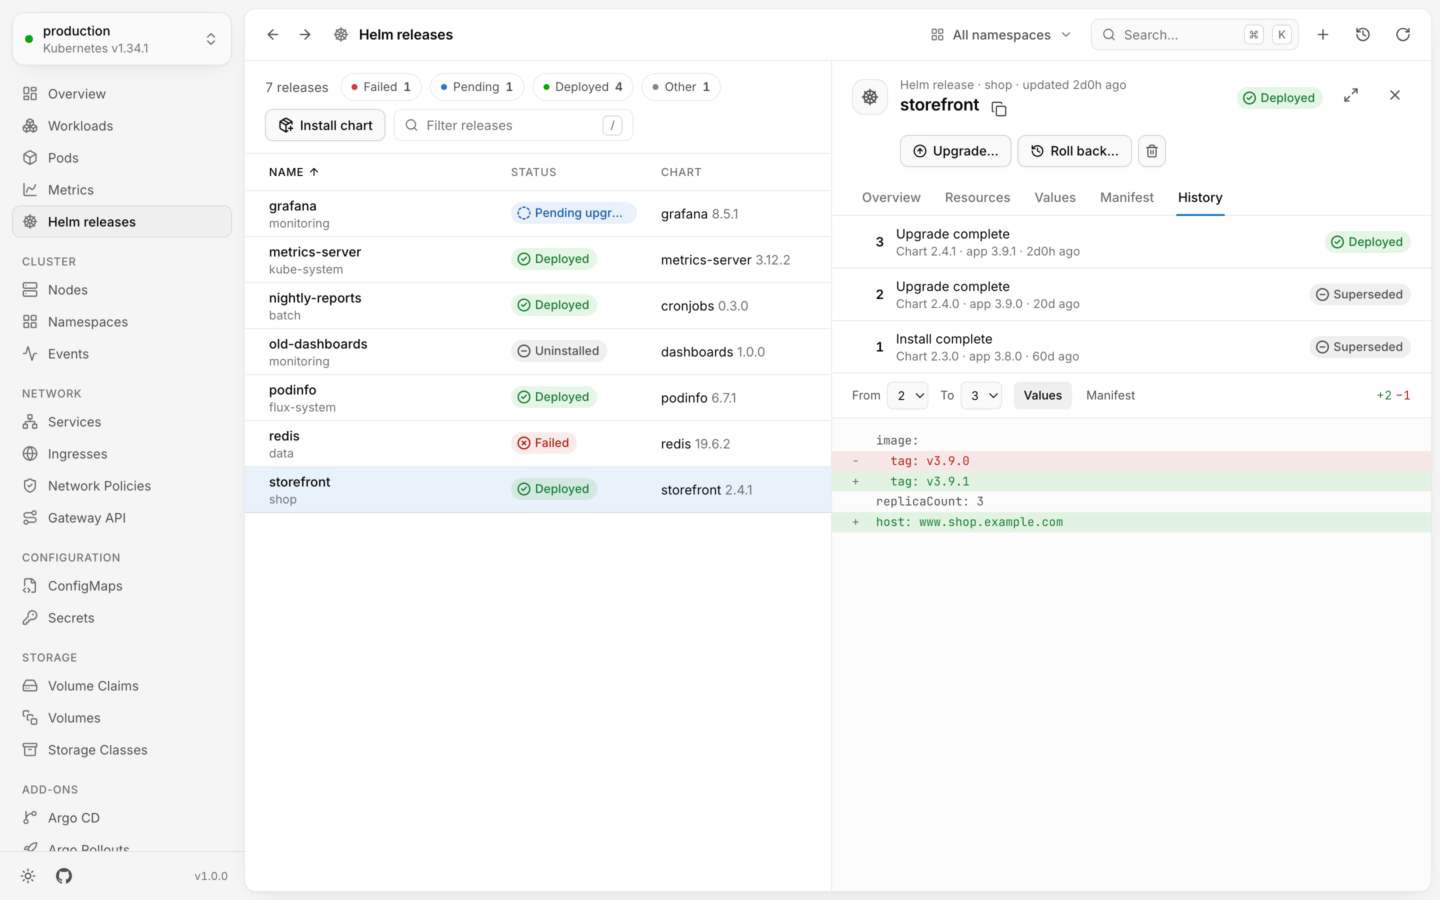
Helm releases, with the storefront release’s history and a diff of its values between revisions.Helm releases, with the storefront release’s history and a diff of its values between revisions.
Karpenter’s page: its node pools against their limits, the nodes they launched, one being replaced, and a pod waiting for a node.Karpenter’s page: its node pools against their limits, the nodes they launched, one being replaced, and a pod waiting for a node.

What needs attention, live usage against what’s allocatable, and every node’s load. Overview

Press G then a letter to switch views, just like in the app. Every shortcut

Map

See what it’s connected to. And what’s missing.

Every object has a map: what leads to it, from the gateway and routes to the services and policies in front of it, and what it uses, from its pods and the ConfigMaps and Secrets they read to the nodes they run on. Point at anything to trace its chain. What’s missing or unwell takes its color, so you see it first.

Deployment · shopstorefrontReady

Above it, what leads to it; below, what it uses.Routes, ownsUses

What stands out

Object details
Change things safely

Every change shows its kubectl. And comes with undo.

checkout has crash-looped since its last rollout. Roll it back, watch its pods come up one by one, and undo it if that wasn’t it. Lumovi checks your permissions first.

Roll back checkout

Deployment in shop on demo

Degraded · 1/3
kubectl rollout undo deployment/checkout -n shop --context demo --to-revision=6
Changing things safely
Capacity

See where your capacity goes. And why a pod can’t start.

Each node as the scheduler sees it: what its pods request against what it can give, and what they really use. When a pod waits for room, you can see there isn’t any. Right-sizing then says what each workload should request, from a week of its use.

Each node’s room

  • Requested
  • Used
  • Free

redis-1 asks for 2 GiB of memory. Every node that’s ready has less than that left, so it waits.

Live usage
Features

Made for the day something breaks. Calm on all the others.

Problems sort to the top

Every object gets a clear status, and whatever is failing comes first. You won’t scroll past 400 healthy pods to find the one that isn’t.

Health and status
  1. db-migratebatchJobFailed0/1 done
  2. recommendationsshopDeploymentUnavailable0/1
  3. checkoutshopDeploymentDegraded1/3
  4. redisdataStatefulSetDegraded1/2
  5. backfillbatchJobRunning0/1 done
  6. cartshopDeploymentReady2/2
  7. corednskube-systemDeploymentReady2/2
  8. grafanamonitoringDeploymentReady1/1

Helm releases, read in place

Status, values, what it made and every revision, with a diff between any two. Upgrade, or install from Artifact Hub or your computer: a dry run first, then your own helm.

Helm releases
  1. 3Upgrade completeChart 2.4.1 · app 3.9.1 · 2d agoDeployed
Values, 2 → 3

⌘K goes anywhere

Jump to any view, object, namespace or cluster. Every view has a shortcut, and lists work with the arrow keys. Try it.

Finding things

    Logs from every pod, in order

    A workload’s pods merged in the order they wrote, each line marked with its pod. Pods that start later join in. Keep only errors, leave a pod out, or read a crashed container’s last run.

    Logs
      In your cluster

      The same app, for your whole team.

      Install the Helm chart and Lumovi runs in the cluster, as a dashboard your team opens in a browser. Nobody installs anything, and everyone sees and changes only what their own permissions allow.

      Signed in as[email protected]platformon-call

      Signed in with single sign-on. Lumovi acts as them.

      Can see and change every namespace.

      • With a token

        auth.mode: token

        People paste a token the cluster accepts, a service account’s or one from your identity provider, and the cluster checks each request made with it. Lumovi’s own service account needs no permissions.

      • With single sign-on

        auth.mode: oidc

        Dex, Keycloak, Okta, Entra ID, Google or GitLab. Lumovi acts as whoever signs in, or passes their own token on when the API server already trusts the provider.

      • Behind a proxy

        auth.mode: proxy

        oauth2-proxy or Pomerium signs people in and names them in a header. The chart’s network policy keeps out everything but the proxy.

      • Every page has an address. Send someone the pod, its logs or the release you’re looking at.

      • Never more than each person’s own RBAC, shells on nodes too, and readOnly: true keeps everyone from changing anything.

      • A small image for amd64 and arm64 that runs as non-root, has no shell and writes only to /tmp.

      Fleet

      Every cluster at once. Private ones too.

      One Lumovi in a browser for all of your clusters. Each is summed up the way its overview would, what needs attention comes first, and everyone sees each cluster as their own RBAC there allows.

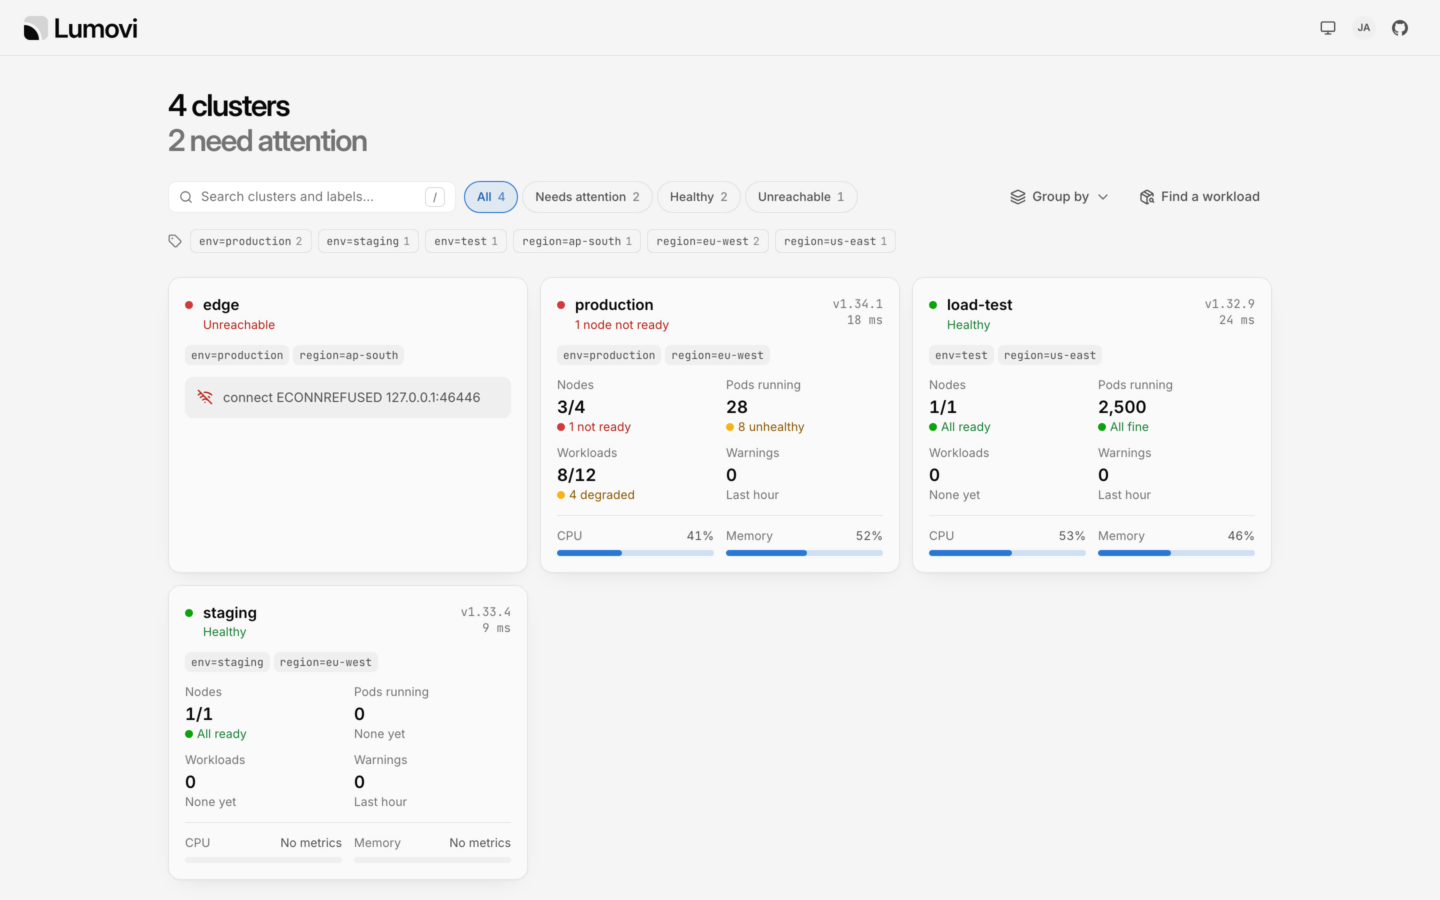
      Lumovi’s fleet: four clusters, two of which need attention, each with its nodes, pods, workloads, warnings, CPU and memory, its version and how fast it answers. One can’t be reached, and says why.Lumovi’s fleet: four clusters, two of which need attention, each with its nodes, pods, workloads, warnings, CPU and memory, its version and how fast it answers. One can’t be reached, and says why.

      Each cluster summed up as its overview would, what needs attention first, and its labels to filter and group by. A fleet of clusters

      • Lumovi acts as whoever signs in, with single sign-on or a proxy, or passes their own token on to clusters that trust your identity provider.

      • An agent in the cluster dials out to Lumovi. Nothing in it listens, no firewall lets anything in, and TLS runs to the API server through it.

      • Clusters found for you

        LUMOVI_FLEET_KUBECONFIG

        From a kubeconfig, or the Secrets Cluster API and Argo CD already keep, with each one’s labels and who may see it.

      • In a cluster with the Helm chart, on a VM, or on a platform like Sevalla from the image, with every setting in its environment.

      Custom resources

      Every other kind, too.

      Lumovi finds custom resources through discovery and shows them with the columns kubectl get prints and a status read from their conditions. Views add the columns, links and actions that matter for popular projects, and each tool the cluster runs gets a page of its own, with what’s failing first.

      • cert-manager
      • Argo CD
      • Argo Rollouts
      • Flux
      • Gateway API
      • Karpenter
      • KEDA
      • External Secrets
      • Prometheus Operator
      • CloudNativePG
      • Istio
      • Velero
      • Crossplane
      • Your own
      ~/.lumovi/views/certificates.yaml
      apiVersion: lumovi.dev/v1alpha1kind: Viewmetadata:name: cert-manager-certificatesspec:kinds:- { group: cert-manager.io, kind: Certificate }columns:- { name: Hosts, path: '.spec.dnsNames[*]' }- { name: Expires, path: .status.notAfter, type: date }status:- when:path: '.status.conditions[?(@.type=="Ready")].status'equals: 'True'health: healthylabel: Readylinks:- name: Secretkind: SecretobjectName: '{{ .spec.secretName }}'

      Views are data only. They read fields with JSONPath and change objects only with the patches they spell out. View format

      • Terminals and port forwards

        In the desktop app, your own shell with kubectl and helm already pointed at the cluster and namespace you’re in, and port forwards to pods and services on localhost.

      • Shells, in containers and on nodes

        A shell in any container, or on any node, as root. A debug container brings tools to a pod that has none, distroless included. Each person’s RBAC decides.

      • Many at once

        Select rows with Shift-click or X, then restart, cordon, suspend or delete them together, with a retry for any that fail.

      • Hard to do by accident

        Destructive dialogs start on Cancel. Anything in a cluster named like production asks you to type the name first.

      • Read-only when you want it

        Turn changes off for one cluster, or for everyone with LUMOVI_READ_ONLY=1 (readOnly in the chart). Lumovi enforces it, not just the buttons.

      • Works with your kubeconfig

        Multiple files, client certificates, tokens and exec plugins like gke-gcloud-auth-plugin, aws eks get-token and kubelogin.

      • Built for big clusters

        Lists load in chunks of 500 and are paginated and virtualized, so thousands of pods stay smooth.

      • Calm when things go wrong

        A lost connection shows a banner and keeps the last data on screen instead of a blank window.

      • Tested end to end

        100% of every line and branch, measured across the desktop app and the server on macOS, Windows and Linux. The chart is installed on a real cluster too.

      Why I built it

      I wanted to open a cluster and know in a second whether it was healthy, and if it wasn’t, where to look first.

      I work on Sevalla. It runs apps, databases and static sites on Kubernetes, and the whole point is that our users never have to think about Kubernetes. They push code, and we look after the clusters.

      That means we watch a lot of clusters. Every day I’d jump between them to check on nodes, pods and capacity. The tools I had were a terminal or a wall of tables. They could tell me anything, just not at a glance.

      I like to see things. A failing pod should look like a failing pod, and a node that’s out of memory should stand out before anyone has to ask. So I built the app I wanted to open every morning.

      Lumovi started as a tool for my own work. It’s free and open source, because anyone who runs a cluster should have one like it.

      Peter

      Sponsors

      Free and open source. Kept bright by its sponsors.

      Lumovi is free, and it stays free. Sponsoring it gives me the time to keep making it better: new views, faster lists, fewer bugs, and all the quiet work behind a good release.

      Sponsor on GitHub
      Lighthouse sponsors

      Their logos stand here, with a link, for everyone who comes to lumovi.dev.

      • Spark

        $5 a month

        Every bit of light helps. You keep Lumovi free, open and moving forward.

        • The Sponsor badge on your GitHub profile
        • My real thanks
      • Glow

        $25 a month

        For people who open Lumovi every day. Your support turns into new views, faster lists and fewer bugs.

        • The Sponsor badge on your GitHub profile
        • My real thanks
      • Beam

        $100 a month

        For teams who rely on Lumovi to keep an eye on their clusters.

        • Your name and a link in Lumovi’s README
        • The Sponsor badge on your GitHub profile
      • Lighthouse

        $500 a month

        For companies that run on Kubernetes and want Lumovi to keep shining.

        • Your logo and a link here, on lumovi.dev
        • Your logo and a link in Lumovi’s README
        • The Sponsor badge on your organization’s profile

      Rather give once? A one-time thank you of $10 means more than you’d think, and it all goes into the app.

      Rather not run Kubernetes?

      Sevalla keeps the clusters out of your way.

      Push your code and Sevalla builds your app, runs it and scales it on Kubernetes, with its databases next to it. You pay for the resources you use, and you never write a manifest.

      storefront
      Web process · 3 instances
      Latest deployment
      9e2b71dFix the cart total for discount codes
      mainDeployment successful
      Try Sevallalumovi.dev is hosted on Sevalla, and your Lumovi fleet can be too.

      Get Lumovi.

      Free and open source under the Apache 2.0 license, with no telemetry. Download it for your computer, or install it in your cluster for everyone on your team.

      LatestVersion 1.2.0, released October 5, 2026.Release notesSHA-256 checksums Verify your download

      On your computer

      It keeps itself up to date. Install the desktop app
      Or build it yourself with Node.js 24 or laterBuild from source
      git clone https://github.com/Lumovi/Lumovi && cd Lumovi && npm ci && npm run dist
      Kubernetes
      1.25 or later
      kubectl
      Not needed
      Helm
      Only to change releases
      • Helm chart

        Any cluster on Kubernetes 1.25 or later. Then open localhost:8080 and sign in with a token.

        Install Lumovi in your cluster
        helm install lumovi oci://ghcr.io/lumovi/charts/lumovi \
          --namespace lumovi --create-namespace
        kubectl port-forward --namespace lumovi service/lumovi 8080:80

        Then give it an address of its own, sign people in with single sign-on, or see every setting. The same chart runs a fleet for many clusters, and an agent in private ones.

      • Container image

        Without Kubernetes, on a machine of its own: Lumovi shows a cluster, or a fleet of them, from a kubeconfig.

        Run it without Kubernetes
        docker run --rm -p 8080:8080 \
          -v "$PWD/kubeconfig:/kubeconfig:ro" -e KUBECONFIG=/kubeconfig \
          ghcr.io/lumovi/lumovi

        For linux/amd64 and arm64. Each release is signed with a build provenance attestation, which you can verify.